Photo by Nathan Bingle on Unsplash

The other day I was integration testing a Saga in the kliento code base. The tests failed and I wanted to skim through the logs to find something meaningful.
Scrolling through thousands of lines of log in a monochrome style is no fun... (to me this approach sometimes is easier than debugging anyway).
First things first: how do I get this output?
When spinning up my tests in Alba, I'm registering a XUnit sink for Serilog, so I get my logs redirected to the test output window in Rider:
public class When_recording_a_lead_inquiry_from_email : IAsyncLifetime
{
  public When_recording_a_lead_inquiry_from_email(
    ITestOutputHelper testOutputHelper
  )
  {
    _testOutputHelper = testOutputHelper;
  }

  public async Task InitializeAsync()
  {
    var testServices = new TestServices();
    var configuration = await testServices.GetTestConfigurationRoot();

    var serilogLogger = Log.Logger = new LoggerConfiguration()
      .MinimumLevel.Debug()
      .WriteTo.Console()
      .WriteTo.TestOutput(_testOutputHelper)
      .CreateLogger();

    var dotnetILogger = new SerilogLoggerFactory(serilogLogger)
      .CreateLogger<Program>();

    var builder = ConfigureHost.GetHostBuilder(
      configuration,
      services =>
      {
        services.AddSingleton<ILogger>(dotnetILogger);
      });

    // arrange act assert...
  }
}
My test output looks like this then:
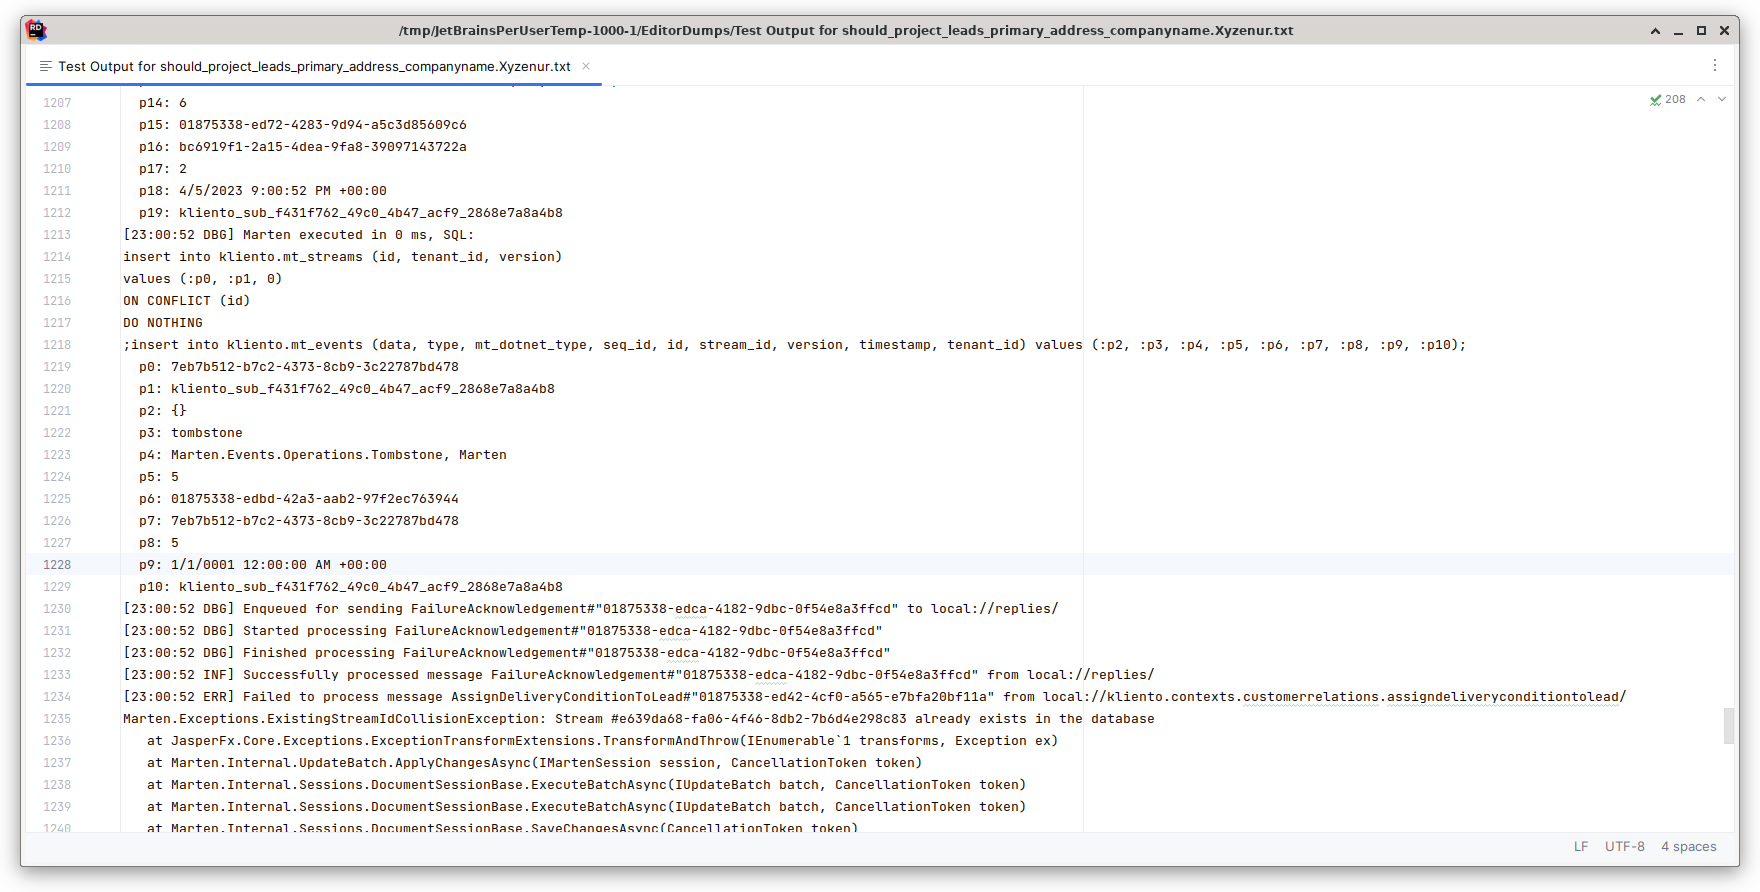
While scrolling through the look I was thinking "would be nice if there would be some color coding for the log in Rider...".
And the next step was to spin up a search which eventually ended up on the landing page for "GrepConsole", a plugin for IntelliJ based IDEs like Rider which does exactly what I was looking for: colorize my test output logs.
After playing around with some settings, my logs now look like this:
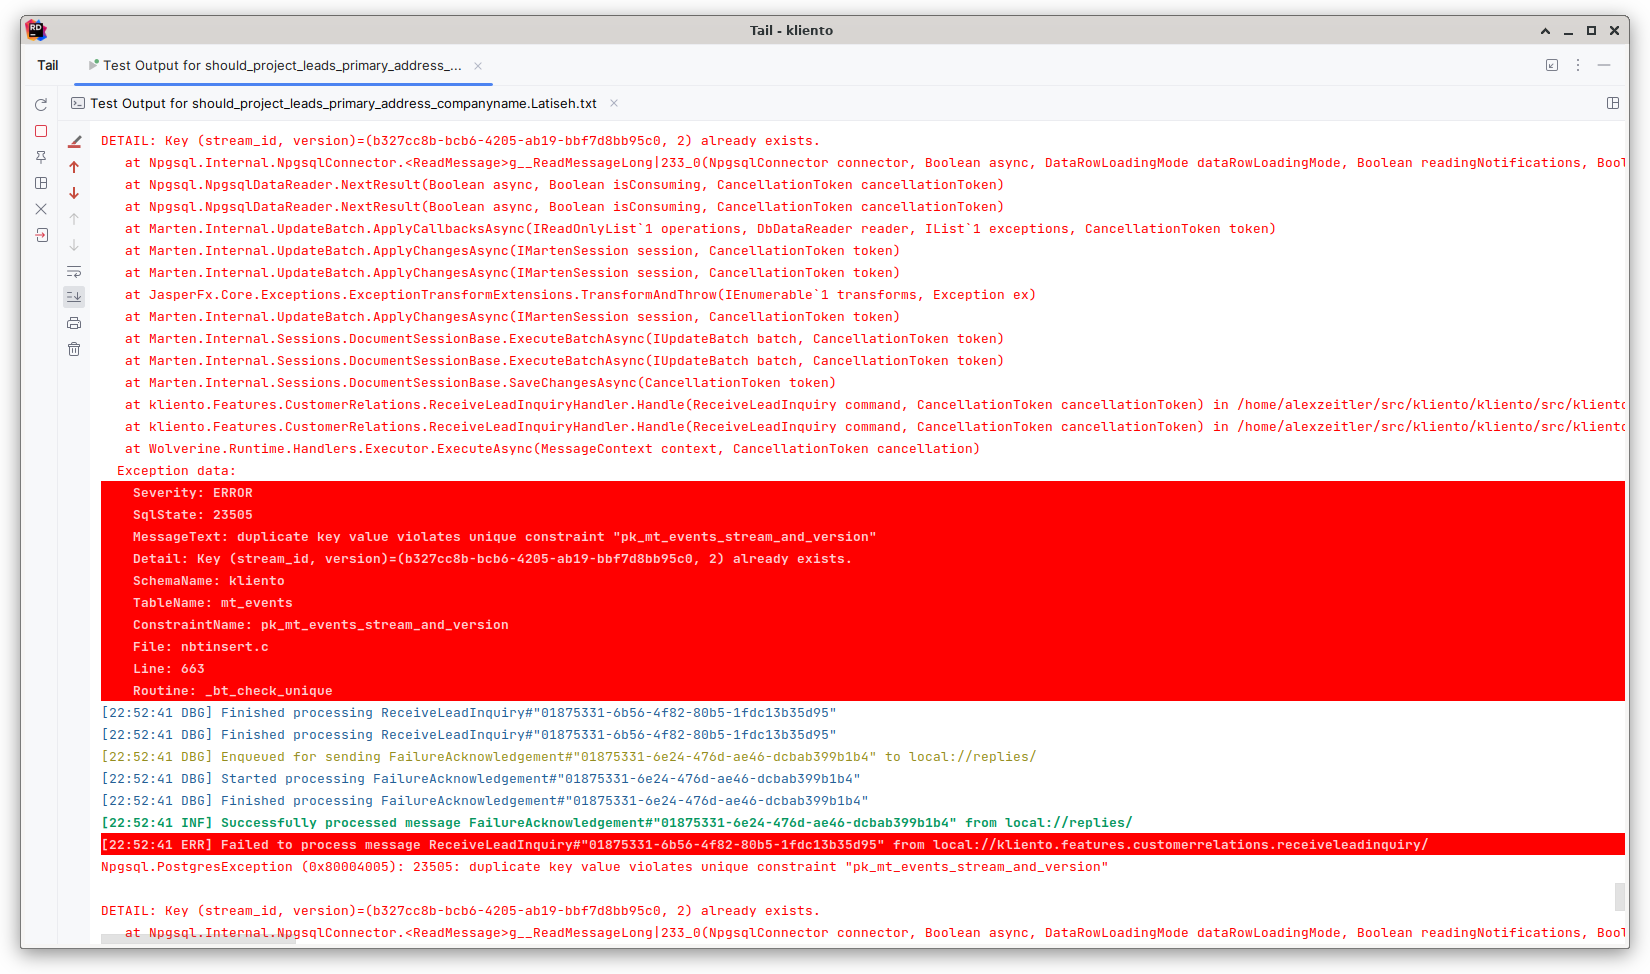
Much easier to spot exceptions, isn't it?
What's even better: you can add arbitrary expressions to filter and colorize fragments or lines.
So I set up a section for regular .NET log output colors and I added another one for Wolverine status messages. That way I can easily spot successful or failed messages.
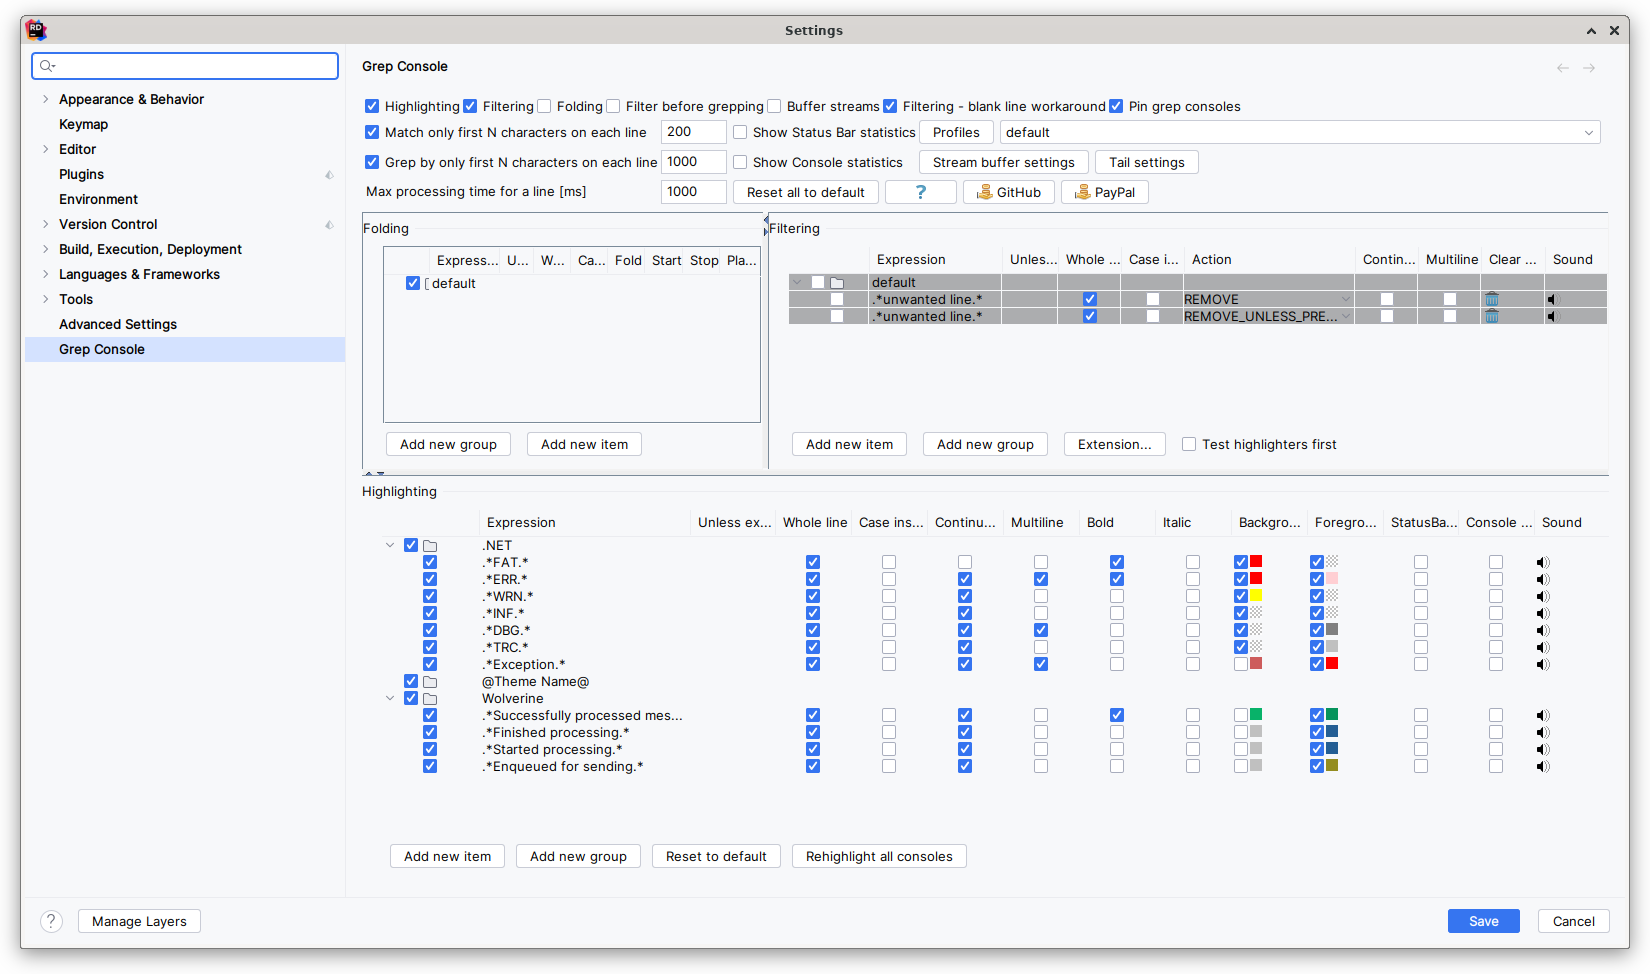
That's my GrepConsole config so far:
Right now, there's only one downside: I didn't find a way in Rider to export/import these settings although this seems to work in other JetBrains IDEs.
Update
Looks like the settings get synced using repository sync 🎉️